This is one of the most powerful price action trading strategies you will ever learn, it’s one of my favorite patterns. You need to learn this, and apply it. Enjoy the lesson
 This is a quality article explaining the 50% fib retracement when used in conjunction with a price action reversal conformation, ideally a pin bar setup or fakey bar reversal setup. Remember to Comment Below.
For the record, I am only a fan of trading the 50% retracement off a swing on the daily forex charts, as long as there is a price action signal to confirm its validity I will consider it. My trading is all about confluence and finding evidence to support the price signals on the charts. I may also add that I trade the major currency pairs where this has a higher probability of success, given the major pairs are widely followed and many setups are straight forward and simple.
The process of trading the 50% retracement is simple, below is one example of a recent trade on AUDUSD pair.
1. When you have a price action signal present on the daily chart, you then match up the fib 50% retracement level if there is one present (see chart example below), if the price action candlestick signal matches up with the 50% swing retracement level then your good to go and potentially have a valid trade. If you can also find a relevant horizontal level to match up here, its a double whammy of confluence (a reason to get excited).
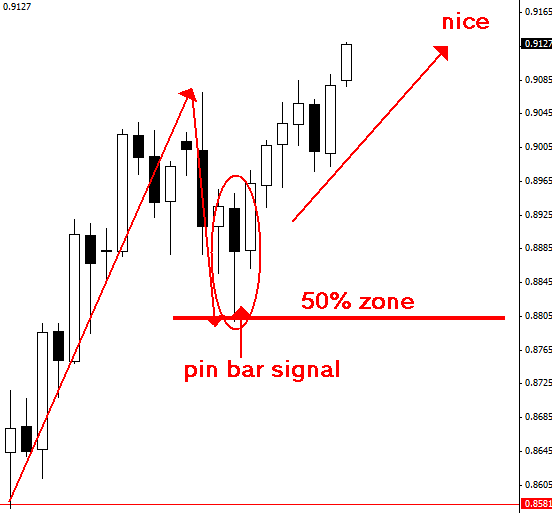
2. After finding the potential trade signal, decide to enter at market prices, or wait for a pull back to get your stop loss tighter to reduce overall risk. In the chart example below, given the perfection of the setup, as prices started to move up in the correct directon, a long entry could have been taken, momentum in the correct direction is always a good sign.
3. These setups are rare, but still something to look for in your daily chart time frames. I personally feel that when a trader looks for the price action signal first, then matches up the supporting factors they tend to make better trades. What I am saying here is this… if you see a giant signal on the daily chart, find out what other factors are back it up and showing supportive evidence, we wont always be able to trade a signal, mainly because we prefer not to fight the natural trend of the market, and many times we see signals forming against the trend.
4. The 50% swing retracement line and price action signal both came together at one common point and showed us a nice setup here, but what you should really take away from this example is that it was in line with the general thrust of the market, notice that prior to the pull back, we saw a nice rally up, and the pull back did not exceed the 50% area , rather it rejected it strongly and has now bounced aggressively higher to the new recent highs.
Another nice recent example on AUDJPY
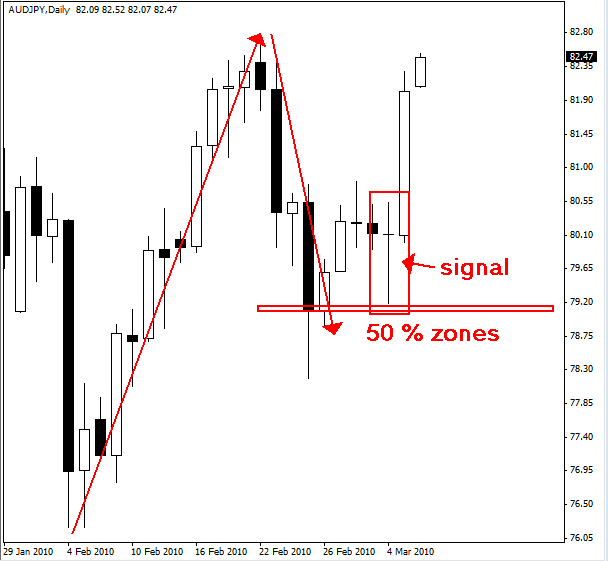
I truly hope this article clears some confusion about Fibonacci levels, personally I only get a handful of these setups every month on the daily charts, but when you see these swing retracements inside general trend movement, its wise to mark them on your charts and then look for some confirmation.
Source : http://www.learntotradethemarket.com/forex-trading-strategies/trading-50-percent-retracements-price-action?awt_l=IQZtw&awt_m=1phchrJKuXwtMW
ليست هناك تعليقات:
إرسال تعليق